Useful charts can serve to persuade an audience of certain "truths", because they take real data and communicate it in a clear, visual medium.
But what happens when you know something to be true, but you have no real data? Should you let the lack of hard data prevent you from creating graphs that communicate your intuitive findings? Of course not -- that's why we have GraphJam. GraphJam is a web site that lets you create and post charts that illustrate your subjective truths.
I have found that the users of GraphJam make heavy use of the pie chart. As we know, pie charts are for amateurs. Anyone with a protractor, a straight edge and some crayons can create a pie chart.
With SAS, we can do so much better. To prove it, I have used the new KPI features in SAS 9.2, along with the SAS Enterprise Guide report builder, to create this Breakroom Dashboard. It's my new home page for checking on the status of the breakroom facilities on 3rd floor of Building R at SAS headquarters in Cary.
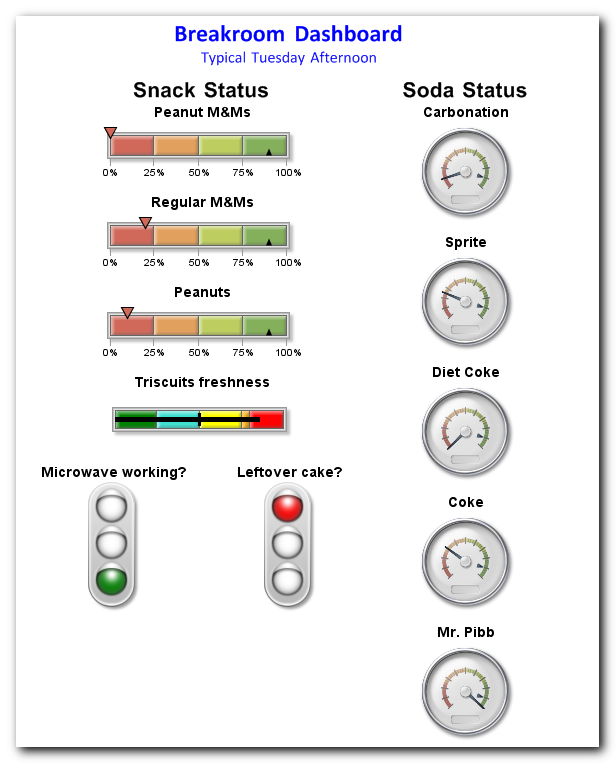
Of course the data values are inferred from personal observations (okay, I made them up) for now. I'm planning to petition our IT department to have monitoring equipment installed, including M&M counters and a CO2 meter for the soda machine. I'll then be able to feed that data into my SAS program and, hopefully, avoid future disappointment when venturing from my office for some refreshments.
I know what you're thinking: this is brilliant. I should apply for a patent and start a breakroom-monitoring service. While I'd love to take credit for being original, I know I'm not the first one to think of this.
P.S. For the curious, here is some of the code that I used to create these indicators:
 goptions reset=all device=javaimg;
 goptions xpixels=200 ypixels=80;
 proc gkpi mode=raised;
 hslider actual=0 bounds=(0 .25 .50 .75 1) /
    target=.9  nolowbound format="percent8." noavalue
    lfont=(f="Calibri" height=.5cm)
    label='Peanut M&Ms';
 run;
 proc gkpi mode=raised;
 hslider actual=.2 bounds=(0 .25 .50 .75 1) /
    target=.9  nolowbound format="percent8." noavalue
    lfont=(f="Calibri" height=.5cm)
    label='Regular M&Ms';
 run;
 proc gkpi mode=raised;
 hslider actual=.1 bounds=(0 .25 .50 .75 1) /
    target=.9  nolowbound format="percent8." noavalue
    lfont=(f="Calibri" height=.5cm)
    label='Peanuts';
 run;

 goptions xpixels=150 ypixels=150;
 proc gkpi mode=raised;
    trafficlight actual=0 bounds=(3 2 1 0) /
    colors=(green yellow red) noavalue
     lfont=(f="Calibri" height=.5cm)
     label="Leftover cake?";
 run;
P.P.S. Hat tip to @annmariastat for the GraphJam pointer.

6 Comments
Cool. Is there a point-n-click interface to GKPI in EGuide 4.2?
Doc,
No, there isn't -- but we have one in the works for our next version.
As you can see from the syntax, there isn't much to it. Define a range, a target, and an actual value, then GKPI just replays that with the indicator you choose. The heavy lifting is in deciding what ranges to use and computing the actual value.
Chris
Hi Chris, thanks for the posting. Would appreciate seeing more of your code--the method to get GKPI output into a GREPLAY dashboard seems rather crude: from my reading you need to generate temporary HTML and PNG files and then use GSLIDE to get the dials back into a catalog?
Cheers
In my example, I used the Report Builder in SAS Enterprise Guide to layout the report and assemble the various charts from GKPI.
For an HTML report, you could also use ODS tagsets.htmlpanel to organize the page in a gridded layout.
More here:
http://support.sas.com/kb/38/066.html
Chris
Pingback: Creating KPI dashboards in SAS Enterprise Guide - The SAS Dummy
Pingback: Lookin’ professional - The SAS Dummy